Analysis of the Probable Impact of Ralph Nader and One Florida County’s Confusing Ballot Design on the 2000 US Presidential Election
Updated November 9, 2020; Originally published in 2014 | Click to download as a PDF
- The major candidates in the 2000 presidential election were Democrat Al Gore and Republican George W. Bush. Also running were Ralph Nader for the progressive Green Party and Pat Buchanan representing the conservative Reform Party.
- Gore received 543,895 more popular votes than Bush, but Bush won one more than the required 270 votes in the Electoral College.
- Many Democrats believed that Nader took votes away from Gore and was a decisive factor in Bush’s Electoral College win because the Green Party was ideologically closer to Democrats than to Republicans.
- Bush won the popular vote in 30 states. His margin exceeded the number of votes that went to Nader in all but two of those states, New Hampshire and Florida.
- In New Hampshire, Bush beat Gore by 7,211 votes, and Nader received 22,198 votes. Our analysis on New Hampshire shows that it is unclear whether Nader’s absence from the ballot would have allowed Gore to win the state.
- In Florida, Bush’s margin over Gore was only 537 votes, while Nader received 97,488 votes.
- Florida’s Palm Beach County also used a confusing “butterfly ballot” design, which may have led Gore voters to vote for Buchanan inadvertently.
- If Nader had not been on the ballot in Florida, or if Florida’s Palm Beach County had a different ballot, it is highly likely that Gore would have won the Electoral College and become President.
Table of Contents
I. Executive Summary
II. Introduction
III. Assumptions
IV. Official Votes of the 2000 US Presidential Election
V. Probable Election Outcome Without the Nader Candidacy and/or the Florida West Palm Beach County Butterfly Ballot
Appendix A: Bush, Gore, Nader, and Buchanan Comparison of Candidate Positions on Popular Issues at the Time
Appendix B: The Palm Beach County Butterfly Ballot
Appendix C: Percent of Buchanan Votes
Appendix D: Summary of State and Electoral College Results
Appendix E: Explanation of Party Label Abbreviations
Appendix F: Florida’s Palm Beach County Votes
I. Executive Summary
This paper estimates the impact of Ralph Nader’s candidacy in the 2000 United States presidential election using government voting statistics, straight math, comparisons of the social and political policies of George W. Bush, Al Gore, and Ralph Nader, and the assumption that all votes cast for Al Gore and George W. Bush would have been unchanged had Ralph Nader not run in the 2000 presidential election.
New Hampshire and Florida were the only two states where the number of votes won by Nader exceeded Bush’s margin of victory over Gore.
In New Hampshire, Bush received 273,559 votes compared to Gore’s 266,348 votes, a margin of 7,211 votes. Nader received 22,198 votes in New Hampshire.
In Florida, Bush received 2,912,790 votes compared to Gore’s 2,912,253 votes, a margin of 537 votes. Nader received 97,488 votes in Florida.
Mathematically, based the information laid out below, it seems that Florida was the only state in which Nader probably impacted the results by taking enough votes from Gore to allow Bush to win the state (and therefore the presidency).
The confusing “butterfly ballot” in Florida’s Palm Beach County probably caused at least 682 votes intended for Gore to go to Pat Buchanan (20% of the 3,411 votes for Buchanan in Palm Beach County), which is 145 votes more than the 537 votes by which Bush won the state.
This report therefore focuses on the voting outcome in Florida.
The probable effects of Nader’s candidacy and the “butterfly ballot” on the outcome of the election are:
- Florida: Al Gore would have won Florida, its 25 Electoral College votes, and therefore the presidency if Ralph Nader had not run as a presidential candidate on the Florida ballot; Gore also would have won Florida if not for the confusion caused by Palm Beach County’s ballot;
- New Hampshire: It’s unclear if enough of the votes that Ralph Nader received in New Hampshire would have gone to Al Gore to change the outcome in that state;
- Other states/DC: Ralph Nader being on the ballot in DC and 45 other states (he was not on the ballot in three states) probably did not change the outcome of those races.
II. Introduction
The 2000 United States (US) presidential election was one of only five elections in which the winning candidate lost the popular vote: Quincy Adams in 1824, Hayes in 1876, Harrison in 1888, Bush in 2000, and Trump in 2016.[1]The following five presidents lost the popular vote as indicated, but still won their elections: 2016, Donald Trump lost by 2,868,686 votes; 2000, Bush lost by 537,179 votes; 1888, Benjamin Harrison … Continue reading
US presidents are elected by state electors in the Electoral College, not by popular vote. Electors represent their states and the District of Columbia, and most are required by oath or law to vote for the person of their party winning that state’s election.
There are 538 electors, representing 535 congressional seats and three from the District of Columbia (DC). To be elected president of the US, a candidate must receive at least 270 electoral votes, a majority (50% + 1) of the 538 total electoral votes.
In the 2000 presidential election, George W. Bush (Bush) received 271 electoral votes while Al Gore (Gore) received 266, totaling 537 (one electoral vote short of the 538 because an elector from DC left her ballot blank to protest the District of Columbia’s lack of representation in Congress).
In that November 2000 election, Gore garnered 48.38% of the popular vote (50,999,897) compared to 47.87% (50,456,002 votes) won by Bush.[2]For a chart of Percent of Bush Wins Over Gore, see Appendix D: Percent of Bush Wins Over Gore; Electoral College Results. Even though Gore obtained 543,895 more popular votes than Bush[3]50,999,897 Gore votes less 50,456,002 Bush votes. he lost the election by not capturing enough electoral votes.[4]Federal Election Commission, “2000 Official Presidential General Election Results,” fec.gov, last updated Dec. 2001.
Some ask how a candidate can win the most popular votes but lose the election? That’s the effect of the Electoral College in our Constitution. In part because of state political and population shifts in the states, a candidate losing the popular vote in a presidential race can still win the race, which has happened five times in our country’s history, in 1824, 1876, 1888, 2000 and 2016.[5]“5 Presidents Who Lost the Popular Vote But Won the Election,” history.com, Nov. 2, 2020
Much has been written about the Electoral College and whether it should still exist. That’s a complex area of politics and law but outside the scope of this report.
In looking at the 2000 election popular votes, Florida was the only state where the number of votes won by Ralph Nader (Nader) probably would have changed the outcome of the election because winning in Florida should have given Gore enough electoral votes to win the state and the election.
Even if Nader’s votes didn’t exist, the outcome in the remaining 48 states would not have changed: Gore won 20 states and the District of Columbia even with Nader running, while Bush won 25 states by more than the number of Nader’s votes in each state. Nader was not on the ballot in the other three states that Bush won.[6]Frank Newport and David W. Moore, “Final Poll Shows Presidential Race to Be Dead Heat,” gallup.com, Nov. 1, 2004
In addition, one Florida county’s ballot may have sufficiently confused enough voters that voted for Pat Buchanan (Buchanan) in error, trying or meaning to vote for Gore.
Two decades later, speculation about an alternative outcome of that election continues to be talked about, debated and argued. Looking to shed light on a possible alternative outcomes of the election, this review focuses on several facets of that election that, based on this work’s assumptions, mathematically and with a bit of straightforward analysis, suggest the result of that election was given to Bush by:
- The candidacy of third-party candidate Nader in Florida or;
- By Palm Beach County Florida’s use of a ballot design known as the “butterfly ballot.”
In sum, if all other votes remained the same, except those for Nader and Buchanan in Florida, Gore probably would have won the 2000 presidential election.
III. Assumptions
This Review is based on five assumptions:
Assumption Number 1
If Nader was not in the race, all other Bush and Gore votes in the 2000 election would have been the same (except this report’s apportionment of the Nader votes).
We have found no authority or analysis on the question of what the votes would have been without Nader running, except analysis based on broad concepts and personal opinions on various sides of that question. Finding no solid guidance on the question of what the votes would have been had Nader not run, this report assumes the Bush and Gore votes would have stayed the same without Nader running, except for our parceling out the Nader votes to Bush and Gore as set out below.
Assumption Number 2
Had Nader not run, more of his votes would have gone to Gore than to Bush.
This assumption is based on the fact that Nader’s policies and beliefs were closer to those of Gore than Bush. Of the 14 popular social and political issues at that time – Abortion, Affirmative Action, Cuba Embargo, Death Penalty, Education, Health Care, Environment (Arctic drilling and Kyoto), Gay Marriage, Medical Marijuana, Military budget, Social Security privatization, NAFTA and Estate Taxes – Bush and Nader agreed on none (0%) while Gore and Nader agreed on 6 out of the 14 issues (42.85%).
For the three candidates’ positions on those issues, see Appendix A.
Assumption Number 3
Florida’s Palm Beach County’s “butterfly ballot” was unclear and caused confusion among some voters who intended to vote for Gore, but voted for Buchanan by mistake.
This assumption is supported by Palm Beach County’s “butterfly ballot” not being clear to many. That confusion was written about in many news articles at the time and since. The lay out of candidate names on the ballot might have causes some voters intending to select Gore to accidentally vote for Pat Buchanan instead.
That Florida county was a solid Democratic area, shown by Gore’s 269,732 votes to Bush’s 152,951 votes. The 3,411 votes for Buchanan in that county gave him a 0.79 percent of that County’s vote, a 272% increase from 0.29% of the statewide Florida vote he received.
Buchanan himself agreed a short time after that election that the “butterfly ballot” was confusing and that he received more votes for president there than he should have.[7]“(11/09) Patrick J. Buchanan,” The American Presidency Project, presidency.ucsb.edu, Nov. 9, 2000.
Assumption 4
The numbers of votes in Section IV are correct.
The vote numbers in Section IV were sourced from the Federal Election Commission PDF online, “2000 Presidential General Election Results,” fec.gov.[8]Accessed Aug. 24, 2020. These numbers do not include the partial count from Florida. It was partial because the US Supreme Court stopped the recount before it was completed.
Florida’s Palm Beach County votes are shown in two different charts in Appendix F, one for Certified Results from the Recount on Nov. 14, 2000, and those marked Nov. 7, 2000, on the Florida Department of State website.
Assumption 5
The politics of Buchanan were closer to that of Bush than Gore.
Because Buchanan’s policies were closer to Bush than to those of Gore, those who wanted to vote for Bush in Florida’s Palm Beach county should not have been confused in voting for Bush because that part of the butterfly ballot was straightforward, while those who wanted to vote for Buchanan faced the confusing part of that ballot (Appendix B).
The similarities of policies between Buchanan, Bush, and Gore are shown in Appendix A.
IV. Official Votes of the 2000 US Presidential Election[9]Federal Election Commission, “2000 Presidential General Election Results,” fec.gov, PDF, last updated Dec. 2001.
The tables below show the results of the election in each state. See Appendix E for an explanation of party label abbreviations.
1. ALABAMA – Given Bush’s margin of victory over Gore (248,562 votes), reallocating Nader’s 18,323 votes, even if they all went to Gore, wouldn’t have changed Bush’s win in Alabama.
| Candidate | Party [10]For an Explanation of Party Label Abbreviations, see Appendix E: Explanation of Party Label Abbreviations | Votes | % |
|---|---|---|---|
| Bush, George W. | R | 941,173 | 56.48 |
| Gore, Al | D | 692,611 | 41.57 |
| Nader, Ralph | I | 18,323 | 1.10 |
| Buchanan, Pat | I | 6,351 | 0.38 |
| Browne, Harry | LBT | 5,893 | 0.35 |
| Phillips, Howard | I | 775 | 0.05 |
| Scattered | W | 699 | 0.04 |
| Hagelin, John | I | 447 | 0.03 |
| Total Alabama Votes: | 1,666,272 |
2. ALASKA – Given Bush’s margin of victory over Gore (88,394 votes), reallocating Nader’s 28,747 votes, even if they all went to Gore, wouldn’t have changed Bush’s win in Alaska.
| Candidate | Party | Votes | % |
|---|---|---|---|
| Bush, George W. | R | 167,398 | 58.62 |
| Gore, Al | D | 79,004 | 27.67 |
| Nader, Ralph | GRN | 28,747 | 10.07 |
| Buchanan, Pat | REF | 5,192 | 1.82 |
| Browne, Harry | LBT | 2,636 | 0.92 |
| Scattered | W | 1,068 | 0.37 |
| Hagelin, John | NL | 919 | 0.32 |
| Phillips, Howard | CON | 596 | 0.21 |
| Total Alaska Votes: | 285,560 |
3. ARIZONA – Given Bush’s margin of victory over Gore (96,311 votes), reallocating Nader’s 45,645 votes, even if they all went to Gore, wouldn’t have changed Bush’s win in Arizona.
| Candidate | Party | Votes | % |
|---|---|---|---|
| Bush, George W. | R | 781,652 | 51.02 |
| Gore, Al | D | 685,341 | 44.73 |
| Nader, Ralph | GRN | 45,645 | 2.98 |
| Buchanan, Pat | REF | 12,373 | 0.81 |
| Smith, L. Neil | LBT | 5,775 | 0.38 |
| Hagelin, John | NL | 1,120 | 0.07 |
| Phillips, Howard | W | 110 | 0.01 |
| Total Arizona Votes: | 1,532,016 |
4. ARKANSAS – Given Bush’s margin of victory over Gore (50,172 votes), reallocating Nader’s 13,421 votes, even if they all went to Gore, wouldn’t have changed Bush’s win in Arkansas.
| Candidate | Party | Votes | % |
|---|---|---|---|
| Bush, George W. | R | 472,940 | 51.31 |
| Gore, Al | D | 422,768 | 45.86 |
| Nader, Ralph | GRA | 13,421 | 1.46 |
| Buchanan, Pat | REF | 7,358 | 0.80 |
| Browne, Harry | LBT | 2,781 | 0.30 |
| Phillips, Howard | CST | 1,415 | 0.15 |
| Hagelin, Dr. John | NL | 1,098 | 0.12 |
| Total Arkansas Votes: | 921,781 |
5. CALIFORNIA – Gore won California regardless of Nader running.[11]In the states where he received votes, Nader likely took more votes from Gore than from Bush given that Nader’s politics are more closely aligned with Gore’s than with Bush’s. See … Continue reading
| Candidate | Party | Votes | % |
|---|---|---|---|
| Gore, Al | D | 5,861,203 | 53.45 |
| Bush, George W. | R | 4,567,429 | 41.65 |
| Nader, Ralph | GRN | 418,707 | 3.82 |
| Browne, Harry | LBT | 45,520 | 0.42 |
| Buchanan, Patrick J. | REF | 44,987 | 0.41 |
| Phillips, Howard | AIP | 17,042 | 0.16 |
| Hagelin, John | NL | 10,934 | 0.10 |
| McReynolds, David | W | 28 | 0.00 |
| Kenyon, Rev. William M., Sr. | W | 6 | 0.00 |
| Total California Votes: | 10,965,856 |
6. COLORADO – Given Bush’s margin of victory over Gore (145,521 votes), reallocating Nader’s 91,434 votes, even if they all went to Gore, wouldn’t have changed Bush’s win in Colorado.
| Candidate | Party | Votes | % |
|---|---|---|---|
| Bush, George W. | R | 883,748 | 50.75 |
| Gore, Al | D | 738,227 | 42.39 |
| Nader, Ralph | GRN | 91,434 | 5.25 |
| Browne, Harry | LBT | 12,799 | 0.73 |
| Buchanan, Pat | FRE | 10,465 | 0.60 |
| Hagelin, John | NL | 2,240 | 0.13 |
| Phillips, Howard | AMC | 1,319 | 0.08 |
| McReynolds, David | SOC | 712 | 0.04 |
| Harris, James | SWC | 216 | 0.01 |
| Dodge, Earl F. | P | 208 | 0.01 |
| Total Colorado Votes: | 1,741,368 |
7. CONNECTICUT – Gore won Connecticut regardless of Nader running.
| Candidate | Party | Votes | % |
|---|---|---|---|
| Gore, Al | D | 816,015 | 55.91 |
| Bush, George W. | R | 561,094 | 38.44 |
| Nader, Ralph | GRN | 64,452 | 4.42 |
| Phillips, Howard | CNC | 9,695 | 0.66 |
| Buchanan, Pat | REF | 4,731 | 0.32 |
| Browne, Harry | LBT | 3,484 | 0.24 |
| Hagelin, John | W | 40 | 0.00 |
| Reicher, David | W | 4 | 0.00 |
| Harris, James E. | W | 4 | 0.00 |
| Huber, Keith Sherman | W | 3 | 0.00 |
| Strickland, Gloria Dawn | W | 2 | 0.00 |
| Pettway, Sylvester J. | W | 1 | 0.00 |
| Total Connecticut Votes: | 1,459,525 |
8. DELAWARE – Gore won Delaware regardless of Nader running.
| Candidate | Party | Votes | % |
|---|---|---|---|
| Gore, Al | D | 180,068 | 54.96 |
| Bush, George W. | R | 137,288 | 41.90 |
| Nader, Ralph | GRN | 8,307 | 2.54 |
| Buchanan, Pat | REF | 777 | .24 |
| Browne, Harry | LBT | 774 | .24 |
| Phillips, Howard | CON | 208 | .06 |
| Hagelin, John | NL | 107 | .03 |
| Scattered | W | 93 | .03 |
| Total Delaware Votes: | 327,622 |
9. DISTRICT OF COLUMBIA – Gore won DC regardless of Nader running.
| Candidate | Party | Votes | % |
|---|---|---|---|
| Gore, Al | D | 171,923 | 85.16 |
| Bush, George W. | R | 18,073 | 8.95 |
| Nader, Ralph | DCG | 10,576 | 5.24 |
| Browne, Harry | LBT | 669 | 0.33 |
| Scattered | W | 539 | 0.27 |
| Harris, James | SWP | 114 | 0.06 |
| Total DC Votes: | 201,894 |
10. FLORIDA – Bush won by 537 votes, less of a margin than the 97,488 votes for Nader.[12]We used the numbers from the Federal Election Commission PDF, “2000 Presidential General Election Results,” fec.gov. The final certified results in Florida didn’t change any voting totals … Continue reading
| Candidate | Party | Votes | % |
|---|---|---|---|
| Bush, George W. | R | 2,912,790 | 48.85 |
| Gore, Al | D | 2,912,253 | 48.84 |
| Nader, Ralph | GPF | 97,488 | 1.63 |
| Buchanan, Pat | REF | 17,484 | 0.29 |
| Browne, Harry | LBF | 16,415 | 0.28 |
| Hagelin, John | NLF | 2,281 | 0.04 |
| Moorehead, Monica | WW | 1,804 | 0.03 |
| Phillips, Howard | CPF | 1,371 | 0.02 |
| McReynolds, David | SFL | 622 | 0.01 |
| Harris, James | FSW | 562 | 0.01 |
| Chote, May | W | 34 | 0.00 |
| McCarthy, Ken. C. | W | 6 | 0.00 |
| Total Florida Votes: | 5,963,110 |
11. GEORGIA – Given Bush’s margin of victory over Gore (303,490 votes), reallocating Nader’s 13,432 votes, even if they all went to Gore, wouldn’t have changed Bush’s win in Georgia.
| Candidate | Party | Votes | % |
|---|---|---|---|
| Bush, George W. | R | 1,419,720 | 54.67 |
| Gore, Al | D | 1,116,230 | 42.98 |
| Browne, Harry | LBT | 36,332 | 1.40 |
| Nader, Ralph | W | 13,432 | 0.52 |
| Buchanan, Pat | I | 10,926 | 0.42 |
| Phillips, Howard | W | 140 | 0.00 |
| Harris, James | W | 11 | 0.00 |
| Strickland, Gloria Dawn | W | 8 | 0.00 |
| Schriner, Joe | W | 5 | 0.00 |
| Total Georgia Votes: | 2,596,804 |
12. HAWAII – Gore won Hawaii regardless of Nader running.
| Candidate | Party | Votes | % |
|---|---|---|---|
| Gore, Albert | D | 205,286 | 55.79 |
| Bush, George W. | R | 137,845 | 37.46 |
| Nader, Ralph | HGR | 21,623 | 5.88 |
| Browne, Harry | LBT | 1,477 | 0.40 |
| Buchanan, Pat | REF | 1,071 | 0.29 |
| Phillips, Howard | CON | 343 | 0.09 |
| Hagelin, John | NL | 306 | 0.08 |
| Total Hawaii Votes: | 367,951 |
13. IDAHO – Given Bush’s margin of victory over Gore (198,300 votes), reallocating Nader’s 12,292 votes, even if they all went to Gore, wouldn’t have changed Bush’s win in Idaho.
| Candidate | Party | Votes | % |
|---|---|---|---|
| Bush, George W. | R | 336,937 | 67.17 |
| Gore, Al | D | 138,637 | 27.64 |
| Nader, Ralph | W | 12,292 | 2.45 |
| Buchanan, Pat | REF | 7,615 | 1.52 |
| Browne, Harry | LBT | 3,488 | 0.70 |
| Phillips, Howard | CON | 1,469 | 0.29 |
| Hagelin, John | NL | 1,177 | 0.23 |
| Schriner, Joe | W | 4 | 0.00 |
| Daigneau, Gerald | W | 1 | 0.00 |
| Msmere, Merepeace | W | 1 | 0.00 |
| Total Idaho Votes: | 501,621 |
14. ILLINOIS – Gore won Illinois regardless of Nader running.
| Candidate | Party | Votes | % |
|---|---|---|---|
| Gore, Al | D | 2,589,026 | 54.60 |
| Bush, George W. | R | 2,019,421 | 42.58 |
| Nader, Ralph | GRN | 103,759 | 2.19 |
| Buchanan, Pat | I | 16,106 | 0.34 |
| Browne, Harry | LBT | 11,623 | 0.24 |
| Hagelin, John | REF | 2,127 | 0.04 |
| Phillips, Howard | W | 57 | 0.00 |
| McReynolds, David | W | 4 | 0.00 |
| Total Illinois Votes: | 4,742,123 |
15. INDIANA – Given Bush’s margin of victory over Gore (343,856 votes), reallocating Nader’s 18,531 votes, even if they all went to Gore, wouldn’t have changed Bush’s win in Indiana.
| Candidate | Party | Votes | % |
|---|---|---|---|
| Bush, George W. | R | 1,245,836 | 56.65 |
| Gore, Al | D | 901,980 | 41.01 |
| Nader, Ralph | W | 18,531 | 0.84 |
| Buchanan, Pat | I | 16,959 | 0.77 |
| Browne, Harry | LBT | 15,530 | 0.71 |
| Phillips, Howard | W | 200 | 0.00 |
| Hagelin, John | W | 167 | 0.00 |
| McReynolds, David | W | 43 | 0.00 |
| Schriner, Joe | W | 24 | 0.00 |
| Judd, Keith Russell | W | 15 | 0.00 |
| Birchler, David Harold | W | 8 | 0.00 |
| Easton, Earnest Lee | W | 5 | 0.00 |
| Strickland, Gloria Dawn | W | 4 | 0.00 |
| Total Indiana Votes: | 2,199,302 |
16. IOWA – Gore won Iowa regardless of Nader running.
| Candidate | Party | Votes | % |
|---|---|---|---|
| Gore, Al | D | 638,517 | 48.54 |
| Bush, George W. | R | 634,373 | 48.22 |
| Nader, Ralph | IG | 29,374 | 2.23 |
| Buchanan, Pat | REF | 5,731 | 0.44 |
| Browne, Harry | LBT-IA | 3,209 | 0.24 |
| Hagelin, John | N | 2,281 | 0.17 |
| Scattered | W | 1,168 | 0.09 |
| Phillips, Howard | CON | 613 | 0.05 |
| Harris, James | SWP | 190 | 0.01 |
| McReynolds, David | SOC | 107 | 0.01 |
| Total Iowa Votes: | 1,315,563 |
17. KANSAS – Given Bush’s margin of victory over Gore (223,056 votes), reallocating Nader’s 36,086 votes, even if they all went to Gore, wouldn’t have changed Bush’s win in Kansas.
| Candidate | Party | Votes | % |
|---|---|---|---|
| Bush, George W. | R | 622,332 | 58.04 |
| Gore, Al | D | 399,276 | 37.24 |
| Nader, Ralph | I | 36,086 | 3.36 |
| Buchanan, Pat | REF | 7,370 | 0.69 |
| Browne, Harry | LBT | 4,525 | 0.42 |
| Hagelin, John | I | 1,375 | 0.13 |
| Phillips, Howard | CON | 1,254 | 0.12 |
| Total Kansas Votes: | 1,072,218 |
18. KENTUCKY – Given Bush’s margin of victory over Gore (233,594 votes), reallocating Nader’s 23,192 votes, even if they all went to Gore, wouldn’t have changed Bush’s win in Kentucky.
| Candidate | Party | Votes | % |
|---|---|---|---|
| Bush, George W. | R | 872,492 | 56.50 |
| Gore, Al | D | 638,898 | 41.37 |
| Nader, Ralph | GRN | 23,192 | 1.50 |
| Buchanan, Pat | REF | 4,173 | 0.27 |
| Browne, Harry | LBT | 2,896 | 0.19 |
| Hagelin, John | NL | 1,533 | 0.10 |
| Phillips, Howard | CON | 923 | 0.06 |
| Strickland, Gloria Dawn | W | 80 | 0.00 |
| Total Kentucky Votes: | 1,544,187 |
19. LOUISIANA – Given Bush’s margin of victory over Gore (135,527 votes), reallocating Nader’s 20,473 votes, even if they all went to Gore, wouldn’t have changed Bush’s win in Louisiana.
| Candidate | Party | Votes | % |
|---|---|---|---|
| Bush, George W. | R | 927,871 | 52.55 |
| Gore, Al | D | 792,344 | 44.88 |
| Nader, Ralph | GRN | 20,473 | 1.16 |
| Buchanan, Pat | REF | 14,356 | 0.81 |
| Phillips, Howard | CON | 5,483 | 0.31 |
| Browne, Harry | LBT | 2,951 | 0.17 |
| Harris, James | SWP | 1,103 | 0.06 |
| Hagelin, John | NL | 1,075 | 0.06 |
| Total Louisiana Votes: | 1,765,656 |
20. MAINE – Gore won Maine regardless of Nader running.
| Candidate | Party | Votes | % |
|---|---|---|---|
| Gore, Al | D | 319,951 | 49.09 |
| Bush, George W. | R | 286,616 | 43.97 |
| Nader, Ralph | GI | 37,127 | 5.70 |
| Buchanan, Pat | REF | 4,443 | 0.68 |
| Browne, Harry | LBT | 3,074 | 0.47 |
| Phillips, Howard | CON | 579 | 0.09 |
| Scattered | W | 27 | 0.00 |
| Total Maine Votes: | 651,817 |
21. MARYLAND – Gore won Maryland regardless of Nader running.
| Candidate | Party | Votes | % |
|---|---|---|---|
| Gore, Al | D | 1,145,782 | 56.57 |
| Bush, George W. | R | 813,797 | 40.18 |
| Nader, Ralph | GRN | 53,768 | 2.65 |
| Browne, Harry | LBT | 5,310 | 0.26 |
| Buchanan, Pat | REF | 4,248 | 0.21 |
| Scattered | W | 1,462 | 0.07 |
| Phillips, Howard | CON | 919 | 0.04 |
| Hagelin, John | W | 176 | 0.01 |
| Miller, Rachelle OneFamily | W | 3 | 0.00 |
| Officewala, Raj Alison | W | 3 | 0.00 |
| Schriner, Joe | W | 3 | 0.00 |
| Crawford, Alonzo | W | 2 | 0.00 |
| Peters, Jeffrey | W | 2 | 0.00 |
| Brown, Mike K. | W | 1 | 0.00 |
| Easton, Earnest Lee | W | 1 | 0.00 |
| LaBelle, Forrest C. | W | 1 | 0.00 |
| Pearlman, Daniel J. | W | 1 | 0.00 |
| Strickland, Gloria Dawn | W | 1 | 0.00 |
| Total Maryland Votes: | 2,025,480 |
22. MASSACHUSETTS – Gore won Massachusetts regardless of Nader running.
| Candidate | Party | Votes | % |
|---|---|---|---|
| Gore, Al | D | 1,616,487 | 59.80 |
| Bush, George W. | R | 878,502 | 32.50 |
| Nader, Ralph | GRM | 173,564 | 6.42 |
| Browne, Harry | LBT | 16,366 | 0.60 |
| Buchanan, Pat | REF | 11,149 | 0.41 |
| Scattered | W | 3,990 | 0.15 |
| Hagelin, John | U | 2,884 | 0.11 |
| McReynolds, David | W | 42 | 0.00 |
| Total Massachusetts Votes: | 2,702,984 |
23. MICHIGAN – Gore won Michigan regardless of Nader running.
| Candidate | Party | Votes | % |
|---|---|---|---|
| Gore, Al | D | 2,170,418 | 51.28 |
| Bush, George W. | R | 1,953,139 | 46.15 |
| Nader, Ralph | GRN | 84,165 | 1.99 |
| Browne, Harry | LBT | 16,711 | 0.39 |
| Phillips, Howard | UST | 3,791 | 0.09 |
| Hagelin, John | NL | 2,426 | 0.06 |
| Buchanan, Patrick | W | 1,851 | 0.04 |
| Total Michigan Votes: | 4,232,501 |
24. MINNESOTA – Gore won Minnesota regardless of Nader running.
| Candidate | Party | Votes | % |
|---|---|---|---|
| Gore, Al | DFL | 1,168,266 | 47.90 |
| Bush, George W. | R | 1,109,659 | 45.50 |
| Nader, Ralph | GRN | 126,696 | 5.20 |
| Buchanan, Pat | RFM | 22,166 | 0.91 |
| Browne, Harry | LBT | 5,282 | 0.22 |
| Phillips, Howard | CON | 3,272 | 0.13 |
| Hagelin, John | REF | 2,294 | 0.09 |
| Harris, James | SWP | 1,022 | 0.04 |
| Marcus, Eddie Bernard | W | 17 | 0.00 |
| Mooney, Beatrice J. | W | 7 | 0.00 |
| Strickland, Gloria Dawn | W | 4 | 0.00 |
| Total Minnesota Votes: | 2,438,685 |
25. MISSISSIPPI – Given Bush’s margin of victory over Gore (168,230 votes), reallocating Nader’s 8,122 votes, even if they all went to Gore, wouldn’t have changed Bush’s win in Mississippi.
| Candidate | Party | Votes | % |
|---|---|---|---|
| Bush, George W. | R | 572,844 | 57.62 |
| Gore, Al | D | 404,614 | 40.70 |
| Nader, Ralph | I | 8,122 | 0.82 |
| Phillips, Howard | CON | 3,267 | 0.33 |
| Buchanan, Pat | REF | 2,265 | 0.23 |
| Browne, Harry | LBT | 2,009 | 0.20 |
| Harris, James | I | 613 | 0.06 |
| Hagelin, John | NL | 450 | 0.04 |
| Total Mississippi Votes: | 994,184 |
26. MISSOURI – Given Bush’s margin of victory over Gore (78,786 votes), reallocating Nader’s 38,515 votes, even if they all went to Gore, wouldn’t have changed Bush’s win in Missouri.
| Candidate | Party | Votes | % |
|---|---|---|---|
| Bush, George W. | R | 1,189,924 | 50.42 |
| Gore, Al | D | 1,111,138 | 47.08 |
| Nader, Ralph | GRN | 38,515 | 1.63 |
| Buchanan, Pat | REF | 9,818 | 0.42 |
| Browne, Harry | LBT | 7,436 | 0.32 |
| Phillips, Howard | CON | 1,957 | 0.08 |
| Hagelin, John | NL | 1,104 | 0.05 |
| Total Missouri Votes: | 2,359,892 |
27. MONTANA – Given Bush’s margin of victory over Gore (103,052 votes), reallocating Nader’s 24,437 votes, even if they all went to Gore, wouldn’t have changed Bush’s win in Montana.
| Candidate | Party | Votes | % |
|---|---|---|---|
| Bush, George W. | R | 240,178 | 58.44 |
| Gore, Al | D | 137,126 | 33.36 |
| Nader, Ralph | GRN | 24,437 | 5.94 |
| Buchanan, Pat | REF | 5,697 | 1.39 |
| Browne, Harry | LBT | 1,718 | 0.42 |
| Phillips, Howard | CON | 1,155 | 0.28 |
| Hagelin, John | NL | 675 | 0.16 |
| Laible, Forrest C. | W | 11 | 0.00 |
| Total Montana Votes: | 410,997 |
28. NEBRASKA – Given Bush’s margin of victory over Gore (202,082 votes), reallocating Nader’s 24,540 votes, even if they all went to Gore, wouldn’t have changed Bush’s win in Nebraska.
| Candidate | Party | Votes | % |
|---|---|---|---|
| Bush, George W. | R | 433,862 | 62.24 |
| Gore, Al | D | 231,780 | 33.25 |
| Nader, Ralph | GRN | 24,540 | 3.52 |
| Buchanan, Pat | BP | 3,646 | 0.52 |
| Browne, Harry | LBT | 2,245 | 0.32 |
| Hagelin, John | NL | 478 | 0.07 |
| Phillips, Howard | BP | 468 | 0.07 |
| Total Nebraska Votes: | 697,019 |
29. NEVADA – Given Bush’s margin of victory over Gore (21,597 votes), reallocating Nader’s 15,008 votes, even if they all went to Gore, wouldn’t have changed Bush’s win in Nevada.
| Candidate | Party | Votes | % |
|---|---|---|---|
| Bush, George W. | R | 301,575 | 49.52 |
| Gore, Al | D | 279,978 | 45.98 |
| Nader, Ralph | GRN | 15,008 | 2.46 |
| Buchanan, Pat | CF | 4,747 | 0.78 |
| None of These Candidates | – | 3,315 | 0.54 |
| Browne, Harry | LBT | 3,311 | 0.54 |
| Phillips, Howard | IAP | 621 | 0.10 |
| Hagelin, John | NL | 415 | 0.07 |
| Total Nevada Votes: | 608,970 |
30. NEW HAMPSHIRE – Bush won by 7,211 votes, less of a margin than the 22,198 votes for Nader.
| Candidate | Party | Votes | % |
|---|---|---|---|
| Bush, George W. | R | 273,559 | 48.07 |
| Gore, Al | D | 266,348 | 46.80 |
| Nader, Ralph | GRN | 22,198 | 3.90 |
| Browne, Harry | LBT | 2,757 | 0.48 |
| Buchanan, Pat | IDP | 2,615 | 0.46 |
| McCain, John | W | 775 | 0.14 |
| Phillips, Howard | CON | 328 | 0.06 |
| Scattered | W | 219 | 0.04 |
| Hagelin, John | W | 55 | 0.01 |
| Keyes, Alan | W | 50 | 0.01 |
| Bradley, Bill | W | 44 | 0.01 |
| Ventura, Jesse | W | 43 | 0.01 |
| Forbes, Steve | W | 26 | 0.00 |
| Powell, Colin | W | 26 | 0.00 |
| Dole, Bob | W | 13 | 0.00 |
| Perot, Ross | W | 9 | 0.00 |
| Peters, Jeffrey | W | 9 | 0.00 |
| Daigneault, Gerald | W | 7 | 0.00 |
| Total New Hampshire Votes: | 569,081 |
31. NEW JERSEY – Gore won New Jersey regardless of Nader running.
| Candidate | Party | Votes | % |
|---|---|---|---|
| Gore, Al | D | 1,788,850 | 56.12 |
| Bush, George W. | R | 1,284,173 | 40.29 |
| Nader, Ralph | I (GRN) | 94,554 | 2.97 |
| Buchanan, Pat | I (REF) | 6,989 | 0.22 |
| Browne, Harry | I (LBT) | 6,312 | 0.20 |
| Hagelin, John | I (I) | 2,215 | 0.07 |
| McReynolds, David | I (SOC) | 1,880 | 0.06 |
| Phillips, Howard | I (CON) | 1,409 | 0.04 |
| Harris, James | I (SWP) | 844 | 0.03 |
| Total New Jersey Votes: | 3,187,226 |
32. NEW MEXICO – Gore won New Mexico regardless of Nader running.
| Candidate | Party | Votes | % |
|---|---|---|---|
| Gore, Al | D | 286,783 | 47.91 |
| Bush, George W. | R | 286,417 | 47.85 |
| Nader, Ralph | GRN | 21,251 | 3.55 |
| Browne, Harry | LBT | 2,058 | 0.34 |
| Buchanan, Pat | REF | 1,392 | 0.23 |
| Hagelin, John | NL | 361 | 0.06 |
| Phillips, Howard | CON | 343 | 0.06 |
| Total New Mexico Votes: | 598,605 |
33. NEW YORK – Gore won New York regardless of Nader running.
| Candidate | Party | Votes | % |
|---|---|---|---|
| Gore, Al | D | 4,107,697 | 60.21 |
| Bush, George W. | R | 2,403,374 | 35.23 |
| Buchanan, Patrick J. | RTL/BR | 31,599 | 0.46 |
| Nader, Ralph | GRN | 244,030 | 3.58 |
| Hagelin, John | IDP | 24,361 | 0.36 |
| Browne, Harry | LBT | 7,649 | 0.11 |
| Harris, James E. | SWP | 1,789 | 0.03 |
| Phillips, Howard | CON | 1,498 | 0.02 |
| McReynolds, David | W | 2 | 0 |
| Total New York Votes: | 6,821,999 [13]From the source material: “* 138,216 Miscellaneous write- in, blank and void votes were compiled as one total in New York. This figure is not included in ‘Total State Votes.’” |
34. NORTH CAROLINA – Nader was not on the ballot in North Carolina, and thus did not receive any votes that could have changed Bush winning the state.
| Candidate | Party | Votes | % |
|---|---|---|---|
| Bush, George W. | R | 1,631,163 | 56.03 |
| Gore, Al | D | 1,257,692 | 43.20 |
| Browne, Harry | LBT | 12,307 | .42 |
| Buchanan, Pat | REF | 8,874 | .30 |
| McReynolds, David | W | 1,226 | .04 |
| Total North Carolina Votes: | 2,911,262 |
35. NORTH DAKOTA – Given Bush’s margin of victory over Gore (79,568 votes), reallocating Nader’s 9,486 votes, even if they all went to Gore, wouldn’t have changed Bush’s win in North Dakota.
| Candidate | Party | Votes | % |
|---|---|---|---|
| Bush, George W. | R | 174,852 | 60.66 |
| Gore, Al | DNL | 95,284 | 33.06 |
| Nader, Ralph | I | 9,486 | 3.29 |
| Buchanan, Pat | REF | 7,288 | 2.53 |
| Browne, Harry | I | 660 | 0.23 |
| Phillips, Howard | CON | 373 | 0.13 |
| Hagelin, John | I | 313 | 0.11 |
| Total North Dakota Votes: | 288,256 |
36. OHIO – Given Bush’s margin of victory over Gore (165,019 votes), reallocating Nader’s 117,857 votes, even if they all went to Gore, wouldn’t have changed Bush’s win in Ohio.
| Candidate | Party | Votes | % |
|---|---|---|---|
| Bush, George W. | R | 2,351,209 | 49.97 |
| Gore, Al | D | 2,186,190 | 46.46 |
| Nader, Ralph | I | 117,857 | 2.50 |
| Buchanan, Pat | I | 26,724 | 0.57 |
| Browne, Harry | LBT | 13,475 | 0.29 |
| Hagelin, John | NL | 6,169 | 0.13 |
| Phillips, Howard | I | 3,823 | 0.08 |
| Harris, James | W | 10 | 0.00 |
| Total Ohio Votes: | 4,705,457 |
37. OKLAHOMA – Nader was not on the ballot in Oklahoma, and thus did not receive any votes that could have changed Bush winning the state.
| Candidate | Party | Votes | % |
|---|---|---|---|
| Bush, George W. | R | 744,337 | 60.31 |
| Gore, Al | D | 474,276 | 38.43 |
| Buchanan, Pat | REF | 9,014 | 0.73 |
| Browne, Harry | LBT | 6,602 | 0.53 |
| Total Oklahoma Votes: | 1,234,229 |
38. OREGON – Gore won Oregon regardless of Nader running.
| Candidate | Party | Votes | % |
|---|---|---|---|
| Gore, Al | D | 720,342 | 46.96 |
| Bush, George W. | R | 713,577 | 46.52 |
| Nader, Ralph | PG | 77,357 | 5.04 |
| Browne, Harry | LBT | 7,447 | 0.48 |
| Buchanan, Patrick J. | I | 7,063 | 0.46 |
| Scattered | W | 3,419 | 0.22 |
| Hagelin, John | REF | 2,574 | 0.17 |
| Phillips, Howard | CON | 2,189 | 0.14 |
| Total Oregon Votes: | 1,533,968 |
39. PENNSYLVANIA – Gore won Pennsylvania regardless of Nader running.
| Candidate | Party | Votes | % |
|---|---|---|---|
| Gore, Al | D | 2,485,967 | 50.60 |
| Bush, George W. | R | 2,281,127 | 46.43 |
| Nader, Ralph | GRN | 103,392 | 2.10 |
| Buchanan, Patrick J. | REF | 16,023 | 0.33 |
| Phillips, Howard | CON | 14,428 | 0.29 |
| Browne, Harry | LBT | 11,248 | 0.23 |
| Scattered | W | 934 | 0.02 |
| Total Pennsylvania Votes: | 4,913,119 |
40. RHODE ISLAND – Gore won Rhode Island regardless of Nader running.
| Candidate | Party | Votes | % |
|---|---|---|---|
| Gore, Al | D | 249,508 | 60.99 |
| Bush, George W. | R | 130,555 | 31.91 |
| Nader, Ralph | GRN | 25,052 | 6.12 |
| Buchanan, Pat | REF | 2,273 | 0.56 |
| Browne, Harry | LBT | 742 | 0.18 |
| Scattered | W | 329 | 0.08 |
| Hagelin, John | NL | 271 | 0.07 |
| Moorehead, Monica | WW | 199 | 0.05 |
| Phillips, Howard | CON | 97 | 0.02 |
| McReynolds, David | SOC | 52 | 0.01 |
| Harris, James | SWP | 34 | 0.01 |
| Total Rhode Island Votes: | 409,112 |
41. SOUTH CAROLINA – Given Bush’s margin of victory over Gore (220,376 votes), reallocating Nader’s 20,200 votes, even if they all went to Gore, wouldn’t have changed Bush’s win in South Carolina.
| Candidate | Party | Votes | % |
|---|---|---|---|
| Bush, George W. | R | 785,937 | 56.84 |
| Gore, Al | D | 565,561 | 40.90 |
| Nader, Ralph | UC | 20,200 | 1.46 |
| Browne, Harry | LBT | 4,876 | 0.35 |
| Buchanan, Patrick | REF | 3,519 | 0.25 |
| Phillips, Howard | CON | 1,682 | 0.12 |
| Hagelin, John | NL | 942 | 0.07 |
| Total South Carolina Votes: | 1,382,717 |
42. SOUTH DAKOTA – Nader was not on the ballot in South Dakota, and thus did not receive any votes that could have changed Bush winning the state.
| Candidate | Party | Votes | % |
|---|---|---|---|
| Bush, George W. | R | 190,700 | 60.30 |
| Gore, Al | D | 118,804 | 37.56 |
| Buchanan, Pat | REF | 3,322 | 1.05 |
| Phillips, Howard | I | 1,781 | 0.56 |
| Browne, Harry | LBT | 1,662 | 0.52 |
| Total South Dakota Votes: | 316,269 |
43. TENNESSEE – Given Bush’s margin of victory over Gore (80,229 votes), reallocating Nader’s 19,781 votes, even if they all went to Gore, wouldn’t have changed Bush’s win in Tennessee.
| Candidate | Party | Votes | % |
|---|---|---|---|
| Bush, George W. | R | 1,061,949 | 51.15 |
| Gore, Al | D | 981,720 | 47.28 |
| Nader, Ralph | I (GRN) | 19,781 | 0.95 |
| Browne, Harry | I (LBT) | 4,284 | 0.21 |
| Buchanan, Patrick J. | I (REF) | 4,250 | 0.20 |
| Brown, Cathy Gordon | I | 1,606 | 0.08 |
| Phillips, Howard | I | 1,015 | 0.05 |
| Hagelin, John | I (REF) | 613 | 0.03 |
| Venson, Randall | I | 535 | 0.02 |
| Scattered | W | 428 | 0.02 |
| Total Tennessee Votes: | 2,076,181 |
44. TEXAS – Given Bush’s margin of victory over Gore (1,365,893 votes), reallocating Nader’s 137,994 votes, even if they all went to Gore, wouldn’t have changed Bush’s win in Texas.
| Candidate | Party | Votes | % |
|---|---|---|---|
| Bush, George W. | R | 3,799,639 | 59.30 |
| Gore, Al | D | 2,433,746 | 37.98 |
| Nader, Ralph | GRN | 137,994 | 2.15 |
| Browne, Harry | LBT | 23,160 | 0.36 |
| Buchanan, Pat | I | 12,394 | 0.19 |
| Phillips, Howard | W | 567 | 0.01 |
| Wright, James “Jim” | W | 74 | 0.00 |
| McReynolds, David | W | 63 | 0.00 |
| Total Texas Votes: | 6,407,637 |
45. UTAH – Given Bush’s margin of victory over Gore (312,043 votes), reallocating Nader’s 35,850 votes, even if they all went to Gore, wouldn’t have changed Bush’s win in Utah.
| Candidate | Party | Votes | % |
|---|---|---|---|
| Bush, George W. | R | 515,096 | 66.83 |
| Gore, Al | D | 203,053 | 26.34 |
| Nader, Ralph | GRN | 35,850 | 4.65 |
| Buchanan, Pat | REF | 9,319 | 1.21 |
| Browne, Harry | LBT | 3,616 | 0.47 |
| Phillips, Howard | IAP | 2,709 | 0.35 |
| Hagelin, John | NL | 763 | 0.10 |
| Harris, James | SWP | 186 | 0.02 |
| Youngkeit, Louie G. | UN | 161 | 0.02 |
| Kunzler, Keith Lewis | W | 1 | 0.00 |
| Total Utah Votes: | 770,754 |
46. VERMONT – Gore won Vermont regardless of Nader running.
| Candidate | Party | Votes | % |
|---|---|---|---|
| Gore, Al | D | 149,022 | 50.63 |
| Bush, George W. | R | 119,775 | 40.70 |
| Nader, Ralph | PRO/GRN | 20,374 | 6.92 |
| Buchanan, Pat | REF | 2,192 | 0.74 |
| Lane, Denny | GRT-VT | 1,044 | 0.35 |
| Browne, Harry | LBT | 784 | 0.27 |
| Scattered | W | 514 | 0.17 |
| Hagelin, John | NL | 219 | 0.07 |
| McReynolds, David | LU | 161 | 0.05 |
| Phillips, Howard | CON | 153 | 0.05 |
| Harris, James E. | SWP | 70 | 0.02 |
| Total Vermont Votes: | 294,308 |
47. VIRGINIA – Given Bush’s margin of victory over Gore (220,200 votes), reallocating Nader’s 59,398 votes, even if they all went to Gore, wouldn’t have changed Bush’s win in Virginia.
| Candidate | Party | Votes | % |
|---|---|---|---|
| Bush, George W. | R | 1,437,490 | 52.47 |
| Gore, Al | D | 1,217,290 | 44.44 |
| Nader, Ralph | GRN | 59,398 | 2.17 |
| Browne, Harry | LBT | 15,198 | 0.55 |
| Buchanan, Pat | REF | 5,455 | 0.20 |
| Scattered | W | 2,636 | 0.10 |
| Phillips, Howard | CON | 1,809 | 0.07 |
| Hagelin, John | W | 171 | .01 |
| Total Virginia Votes: | 2,739,447 |
48. WASHINGTON – Gore won Washington regardless of Nader running.
| Candidate | Party | Votes | % |
|---|---|---|---|
| Gore, Al | D | 1,247,652 | 50.16 |
| Bush, George W. | R | 1,108,864 | 44.58 |
| Nader, Ralph | GRN | 103,002 | 4.14 |
| Browne, Harry | LBT | 13,135 | 0.53 |
| Buchanan, Patrick | FRE | 7,171 | 0.29 |
| Hagelin, John | NL | 2,927 | 0.12 |
| Phillips, Howard | CON | 1,989 | 0.08 |
| Moorehead, Monica | WW | 1,729 | 0.07 |
| McReynolds, David | SOC | 660 | 0.03 |
| Harris, James E. | SWP | 304 | 0.01 |
| Total Washington Votes: | 2,487,433 |
49. WEST VIRGINIA – Given Bush’s margin of victory over Gore (40,978 votes), reallocating Nader’s 10,680 votes, even if they all went to Gore, wouldn’t have changed Bush’s win in West Virginia.
| Candidate | Party | Votes | % |
|---|---|---|---|
| Bush, George W. | R | 336,475 | 51.92 |
| Gore, Al | D | 295,497 | 45.59 |
| Nader, Ralph | GRN | 10,680 | 1.65 |
| Buchanan, Pat | REF | 3,169 | 0.49 |
| Browne, Harry | LBT | 1,912 | 0.30 |
| Hagelin, John | NL | 367 | 0.06 |
| Phillips, Howard | W | 23 | 0.00 |
| Strickland, Gloria Dawn | W | 1 | 0.00 |
| Total West Virginia Votes: | 648,124 |
50. WISCONSIN – Gore won Wisconsin regardless of Nader running.
| Candidate | Party | Votes | % |
|---|---|---|---|
| Gore, Al | D | 1,242,987 | 47.83 |
| Bush, George W. | R | 1,237,279 | 47.61 |
| Nader, Ralph | WG | 94,070 | 3.62 |
| Buchanan, Pat | I | 11,471 | 0.44 |
| Browne, Harry | LBT | 6,640 | 0.26 |
| Phillips, Howard | CON | 2,042 | 0.08 |
| Scattered | W | 1,896 | 0.07 |
| Moorehead, Monica G. | I | 1,063 | 0.04 |
| Hagelin, John | I | 853 | 0.03 |
| Harris, James | I | 306 | 0.01 |
| Total Wisconsin Votes: | 2,598,607 |
51. WYOMING – Given Bush’s margin of victory over Gore (87,466 votes), reallocating Nader’s 4,625 votes, even if they all went to Gore, wouldn’t have changed Bush’s win in Wyoming.
| Candidate | Party | Votes | % |
|---|---|---|---|
| Bush, George W. | R | 147,947 | 67.76 |
| Gore, Al | D | 60,481 | 27.70 |
| Nader, Ralph | W | 4,625 | 2.12 |
| Buchanan, Pat | REF | 2,724 | 1.25 |
| Browne, Harry | LBT | 1,443 | 0.66 |
| Phillips, Howard | I | 720 | 0.33 |
| Hagelin, John | NL | 411 | 0.19 |
| Total Wyoming Votes: | 218,351 |
V. Probable Election Outcome Without the Nader Candidacy and/or the Florida West Palm Beach County Butterfly Ballot
A. Nader & the Florida Vote
Analysis: In the 2000 presidential election, of the 5,963,110 votes cast in Florida, Bush received 2,912,790, and Gore 2,912,253 votes, giving Bush a 537 vote margin of victory (2,912,790 less 2,912,253). Nader received 97,488 votes.
| Party | # Votes | % Votes | |
|---|---|---|---|
| Bush, George W. | R | 2,912,790 | 48.85 |
| Gore, Al | D | 2,912,253 | 48.84 |
| Nader, Ralph | GPF | 97,488 | 1.63 |
| Other | – | 40,579 | .68 |
| Total Florida Votes: | 5,963,110 | 100 |
If Nader had not run in the election, and if all the votes the other candidates received would have stayed the same, more votes for Nader would likely have gone to Gore than to Bush because Nader was closer to Gore politically than to Bush.[14]See Appendix A: Bush, Gore and Nader Comparison of Candidate Positions on Popular Issues at the Time.
Conclusion: Therefore, if Nader had not run, and looking at how close Nader was to Gore politically, Gore would have probably received at least 51%[15]Based on Appendix A: Gore would have received at least 51% of the Nader votes. of the 97,488 votes Nader received, and in doing so, Gore would have picked up (at least) a net 1,950 votes[16]1,948 = [97,488 x 51% = 49, 719] less [97,488 x 49% = 47,769]. giving Gore at least 2,914,203 Florida votes, 1,413 more votes than Bush, a win in Florida and a win of the presidency.
Because of the number of electoral votes in Florida, that would have given Gore the Electoral College win along with the popular vote win he did get.
B. Buchanan & the Florida Palm Beach County Butterfly Ballot
Analysis: In the 2000 presidential election, Bush won Florida by 537 votes (2,912,790 less 2,912,253); and Buchanan finished fourth with 17,484 votes or 0.29% of the vote.[17]See Florida chart in Section IV. #10
1. State of Florida Vote: Overall in the state, Buchanan won 0.29% of the votes.
| Party | # Votes | % Votes | |
|---|---|---|---|
| Bush, George W. | R | 2,912,790 | 48.85 |
| Gore, Al | D | 2,912,253 | 48.84 |
| Buchanan, Pat | REF | 17,484 | .29 |
| Other | 120,583 | 2.02 | |
| Total Florida Votes: | 5,963,110 | 100 |
2. Florida’s Palm Beach County Votes:
Palm Beach County recorded the following votes.[18]Results At Nov. 7, 2000. Results from the download data page from Florida Department of State website, “November 7, 2000 General Election,” results.elections.myflorida.com, accessed Aug. 14, 2020. In Palm Beach County, Florida, Buchanan received 3,411 of the county’s 433,186 votes, or 0.79% of the county vote.
| Party | # Votes | % Votes | |
|---|---|---|---|
| Bush, George W. | R | 152,951 | 35.31 |
| Gore, Al | D | 269,732 | 62.27 |
| Buchanan, Pat | REF | 3,411 [19]This number was also unofficially 3,407, which comes from votes “received in the initial, uncertified count of PBC ballots.” Source: “The Butterfly Did It: The Aberrant Vote for Buchanan in … Continue reading | .79 |
| Other | 7,092 | 1.63 | |
| Total Palm Beach County Votes: | 433,186 | 100 |
Palm Beach County was the only Florida county using the “butterfly ballot,” and that ballot, according to many media accounts, caused confusion[20]See a picture of that ballot in Appendix B: The Palm Beach County Butterfly Ballot. among some voters trying to vote for Gore, but mistakenly voting for Buchanan.
That ballot listed candidate names on both sides of the page, with punch holes in the middle. Bush’s name was listed first, and the first punch hole corresponded to his name. Gore’s name was listed second, but the third punch hole needed to be selected to cast a vote for him. Selecting the second hole resulted in a vote for Buchanan.
According to the ACLU, no other Florida county used a “butterfly ballot” design; the other Florida counties that used voting machines similar to Palm Beach County all listed the candidates vertically on one page.[21]ACLU, Brief Amicus Curiae of American Civil Liberties Union in Support of Appellants in Fladell v. Palm Beach County Canvassing Board, available at election2000.law.stanford.edu, November 2000.
More than 29,000 ballots in Palm Beach County (4% of the votes cast in that county) were discarded because either no presidential candidate or more than one candidate was selected. The number of double votes was more than four times the historical average for similar punch card voting machines.[22]ACLU, Brief Amicus Curiae of American Civil Liberties Union in Support of Appellants in Fladell v. Palm Beach County Canvassing Board, available at election2000.law.stanford.edu, November 2000.
Democratic Party lawyers gathered 13,000 affidavits, sworn complaints, and other communication from Palm Beach County voters alleging confusion over the “butterfly ballot” or other errors such as misaligned punch holes.[23]Ronald Brownstein, “Bush Holds Slim Lead; Gore Prepares for Further Court Action,” latimes.com, Nov. 26, 2000.
Given that Buchanan received 0.29% of the Florida state vote, but 0.79% of the Palm Beach County votes, Buchanan’s Palm Beach County vote was 272% higher than his 0.29% of the state vote. (0.79% is 272% of 0.29)
That 272% increase in the percentage of votes for Buchanan in Palm Beach County was odd, given that Palm Beach County was a solid Democratic area as shown by the fact that Gore received 269,732 of the County’s 433,186 votes (62.27%) with Bush winning just 152,951 votes (35.31%).[24]See Appendix G: Florida’s Palm Beach County Votes.
When the difficulty of voting for Gore in the “butterfly ballot” became known, on Nov. 9, 2000, Bush spokesman Ari Fleischer said, justifying the increased percentage for Buchanan: “‘Palm Beach County is a Pat Buchanan stronghold and that’s why Pat Buchanan received 3,407 votes there.’”[25]Jake Tapper, “Buchanan camp: Bush claims are ‘nonsense’,” salon.com, Nov. 10, 2000.
However, Fleischer’s statement was undercut by the overwhelming majority of votes Gore received over Bush in that county.[26]See Appendix G: Florida’s Palm Beach County Votes.
“[Buchanan’s Florida coordinator, Jim] McConnell says he and Jim Cunningham, chairman of the executive committee of Palm Beach County’s (and Buchanan’s) Reform Party, estimate the number of Buchanan activists in the [Palm Beach] county to be between 300 and 500 – nowhere near the 3,407 who voted for him.”[27]Jake Tapper, “Buchanan camp: Bush claims are ‘nonsense’,” salon.com, Nov. 10, 2000.
Appearing on The Today Show [NBC, Nov. 9, 2000, two days after the election], Buchanan said: “When I took one look at that ballot on Election Night…it’s very…easy for me to see how someone could have voted for me in the belief they voted for Al Gore.”[28]“(11/09) Patrick J. Buchanan,” The American Presidency Project, presidency.ucsb.edu, Nov. 9, 2000.
Given that the policies of Buchanan were closer to those of Bush than Gore, and given it was clear how to vote for Bush, the mistaken votes for Buchanan should have gone to Gore.
Conclusion: The “butterfly ballot” caused some votes intended for Gore to go to Buchanan. If even 20% of the 3,411 votes for Buchanan (682 votes) were meant for Gore, and the balance remained Buchanan votes, Gore would have had 2,912,935 votes (2,912,253 + 682), and Gore would have won Florida by 145 votes (2,912,935 less 2,912,790) and won the election.
C. Nader & the New Hampshire Vote
Analysis: In New Hampshire, Bush received 273,559 votes, Gore 266,348, and Nader 22,198 votes. Therefore, Bush received 7,211 more New Hampshire votes than Gore (273,559 less 266,348).
| Party | # Votes | % Votes | |
|---|---|---|---|
| Bush, George W. | R | 273,559 | 48.07 |
| Gore, Al | D | 266,348 | 46.80 |
| Nader, Ralph | GRN | 22,198 | 3.90 |
| Other | 6,976 | 1.23 | |
| Total New Hampshire Votes: | 569,081 | 100 |
If Nader had not run, more of Nader’s votes would have gone to Gore than to Bush because Gore was closer politically to Nader than to Bush.[29]See Appendix A: Bush, Gore and Nader Comparison of Candidate Positions on Popular Issues at the Time.
If all of Nader’s 22,198 votes were split between Gore and Bush (assuming that Nader voters would not have stayed home or voted for other third party options), and the other vote totals remained constant, Gore would have needed at least 66.3% of Nader’s votes to beat Bush in New Hampshire.
Gore’s hypothetical total with 66.3% of Nader’s 22,198 votes (0.663 x 22,198 = 14,717 votes extra votes from Nader) plus Gore’s actual total of 266,348 is 281,065. Bush’s hypothetical total with 33.7% of Nader’s votes (0.337 x 22,198 = 7,481 extra votes from Nader) plus 273,559 actual Bush votes is 281,040. This scenario results in Gore winning by 25 votes (281,065 – 281,040 = 25). If Gore received less than 66.3% of the Nader votes, Bush would still have won New Hampshire.
Conclusion: Although Appendix A shows why Gore should have received more of Nader’s votes than Bush, had Nader not run, there is no probable support for the minimum 66.3% of Nader’s votes needed by Gore to win New Hampshire. Therefore, it’s unclear if Nader hadn’t run, whether or not Gore would have won New Hampshire and the presidential election.
APPENDIX A: Bush, Gore, Nader, and Buchanan Comparison of Candidate Positions on Popular Issues at the Time
The following chart shows:
- Bush didn’t agree with Nader on any of the issues below (0.0%) while Gore agreed with Nader on 6 of the 14 issues (42.85%);
- Bush agreed with Buchanan on 9 of the 14 issues (64.29%) while Gore agreed with Buchanan on 5 of the 14 issues (35.71%);
- Based on the comparison below, the Green Party is ideologically closer to Democrats than to Republicans.
| A. Issue | B. Bush | C. Gore | D. Nader | E. Buchanan |
|---|---|---|---|---|
| 1. Abortion Should abortion be legal? | Con | Pro | Pro | Con |
| 2. Affirmative Action: Should affirmative action be used in employment and education? | Con | Pro | Pro | Con |
| 3. Cuba Embargo: Should the US maintain its embargo on Cuba? | Pro | Pro | Con | Con |
| 4. Death Penalty: Should the death penalty be allowed? | Pro | Pro | Con | Pro |
| 5. Education: Should federal funding be linked to standardized test results? | Pro | Pro | Con | Con |
| 6. Health Care: Should the US adopt a single-payer health care system? | Con | Con | Pro | Con |
| 7. Environment: Should the US allow drilling for oil in the Artic National Wildlife Refuge(ANWR)? | Pro | Con | Con | Pro |
| 8. Environment: Should the US sign the Kyoto Protocol (an international agreement to reduce emissions)? | Con | Pro | Pro | Con |
| 9. Gay Marriage: Should gay marriage be legal? | Con | Con | Pro | Con |
| 10. Medical Marijuana: Should marijuana be a medical option? | Con | Con | Pro | Pro |
| 11. Military: Should the US military budget be increased? | Pro | Pro | Con | Pro |
| 12. Social Security: Should Social Security be privatized? | Pro | Con | Con | Pro |
| 13. NAFTA: Is the North American Free Trade Agreement (NAFTA) good for the US? | Pro | Pro | Con | Con |
| 14. Taxes: Should the estate tax be eliminated completely? | Pro | Con | Con | Con |
APPENDIX B: The Palm Beach County Butterfly Ballot
The above photo shows the confusing “butterfly ballot” that listed candidate names on both sides of the page, with punch holes in the middle. Bush’s name was listed first, and the first punch hole corresponded to his name. Gore’s name was listed second, but the third punch hole needed to be selected to cast a vote for him. Selecting the second hole resulted in a vote for Buchanan. It appears from the math that some people trying to vote for Gore may have voted for Buchanan on accident: Buchanan received 0.79% of the votes Palm Beach County, a traditionally Democratic area, which was 272% higher than his 0.29% of the Florida vote overall.
If even 20% of the 3,411 votes for Buchanan (682 votes) were meant for Gore, and the balance remained Buchanan votes, Gore would have had 2,912,935 votes (2,912,253 + 682), and Gore would have won Florida by 145 votes (2,912,935 less 2,912,790) and won the election.
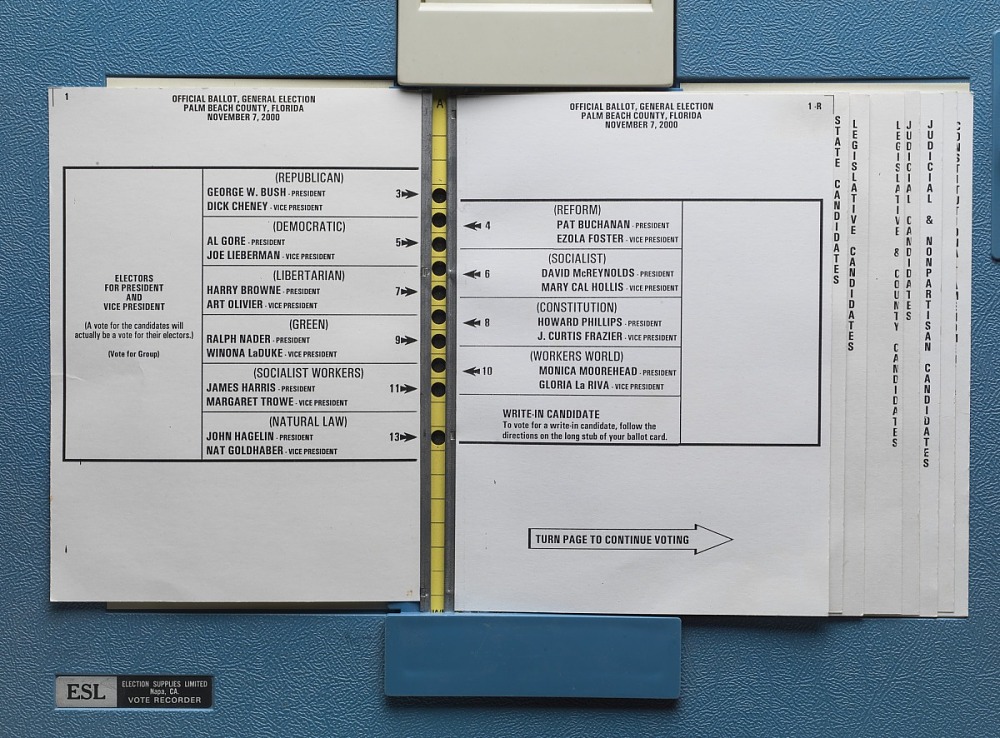
Picture of the ballot used in Palm Beach County, Florida, in the 2000 presidential election. Source: Smithsonian National Museum of American History, “Votomatic Voting Machine, 2000,” americanhistory.si.edu (accessed April 11, 2022)
APPENDIX C: Percent of Buchanan Votes[30]Federal Election Commission, “2000 Official Presidential General Election Results,” fec.gov, last updated Dec. 2001.
This chart shows lowest percent of votes to highest by state for Buchanan. The District of Columbia did not show votes for Buchanan and is therefore not listed on this chart.
| A. State | B. Buchanan Total Votes | C. Buchanan % of Votes | D. Total State Votes | |
|---|---|---|---|---|
| 1 | MICHIGAN | 1,851 | 0.04 | 4,232,501 |
| 2 | TEXAS | 12,394 | 0.19 | 6,407,637 |
| 3 | TENNESSEE | 4,250 | 0.2 | 2,076,181 |
| 4 | VIRGINIA | 5,455 | 0.2 | 2,739,447 |
| 5 | MARYLAND | 4,248 | 0.21 | 2,025,480 |
| 6 | NEW JERSEY | 6,989 | 0.22 | 3,187,226 |
| 7 | MISSISSIPPI | 2,265 | 0.23 | 994,184 |
| 8 | NEW MEXICO | 1,392 | 0.23 | 598,605 |
| 9 | DELAWARE | 777 | 0.24 | 327,622 |
| 10 | SOUTH CAROLINA | 3,519 | 0.25 | 1,382,717 |
| 11 | KENTUCKY | 4,173 | 0.27 | 1,544,187 |
| 12a | FLORIDA (total) | 17,484 | 0.29 | 5,963,110 |
| 12b | FLORIDA – Palm Beach County Vote – Results on Nov. 7, 2000 | 3,411 | 0.79 | 433,186 |
| 13 | HAWAII | 1,071 | 0.29 | 367,951 |
| 14 | WASHINGTON | 7,171 | 0.29 | 2,487,433 |
| 15 | NORTH CAROLINA | 8,874 | 0.3 | 2,911,262 |
| 16 | CONNECTICUT | 4,731 | 0.32 | 1,459,525 |
| 17 | PENNSYLVANIA | 16,023 | 0.33 | 4,913,119 |
| 18 | ILLINOIS | 16,106 | 0.34 | 4,742,123 |
| 19 | ALABAMA | 6,351 | 0.38 | 1,666,272 |
| 20 | CALIFORNIA | 44,987 | 0.41 | 10,965,856 |
| 21 | MASSACHUSETTS | 11,149 | 0.41 | 2,702,984 |
| 22 | GEORGIA | 10,926 | 0.42 | 2,596,804 |
| 23 | MISSOURI | 9,818 | 0.42 | 2,359,892 |
| 24 | IOWA | 5,731 | 0.44 | 1,315,563 |
| 25 | WISCONSIN | 11,471 | 0.44 | 2,598,607 |
| 26 | NEW YORK | 31,599 | 0.45 | 6,960,215 |
| 27 | NEW HAMPSHIRE | 2,615 | 0.46 | 569,081 |
| 28 | OREGON | 7,063 | 0.46 | 1,533,968 |
| 29 | WEST VIRGINIA | 3,169 | 0.49 | 648,124 |
| 30 | NEBRASKA | 3,646 | 0.52 | 697,019 |
| 31 | RHODE ISLAND | 2,273 | 0.56 | 409,112 |
| 32 | OHIO | 26,724 | 0.57 | 4,705,457 |
| 33 | COLORADO | 10,465 | 0.6 | 1,741,368 |
| 34 | MAINE | 4,443 | 0.68 | 651,817 |
| 35 | KANSAS | 7,370 | 0.69 | 1,072,218 |
| 36 | OKLAHOMA | 9,014 | 0.73 | 1,234,229 |
| 37 | VERMONT | 2,192 | 0.74 | 294,308 |
| 38 | INDIANA | 16,959 | 0.77 | 2,199,302 |
| 39 | NEVADA | 4,747 | 0.78 | 608,970 |
| 40 | ARKANSAS | 7,358 | 0.8 | 921,781 |
| 41 | ARIZONA | 12,373 | 0.81 | 1,532,016 |
| 42 | LOUISIANA | 14,356 | 0.81 | 1,765,656 |
| 43 | MINNESOTA | 22,166 | 0.91 | 2,438,685 |
| 44 | SOUTH DAKOTA | 3,322 | 1.05 | 316,269 |
| 45 | UTAH | 9,319 | 1.21 | 770,754 |
| 46 | WYOMING | 2,724 | 1.25 | 218,351 |
| 47 | MONTANA | 5,697 | 1.39 | 410,997 |
| 48 | IDAHO | 7,615 | 1.52 | 501,621 |
| 49 | ALASKA | 5,192 | 1.82 | 285,560 |
| 50 | NORTH DAKOTA | 7,288 | 2.53 | 288,256 |
| TOTAL | 452,306 | 0.43 | 105,774,608 |
APPENDIX D: Summary of State and Electoral College Results
Chart is in order of highest percent of Bush votes to lowest in Column C, and includes Electoral College Results in Columns G and H.[31]“Presidential Election of 2000, Electoral and Popular Vote Summary,” infoplease.com (accessed Nov. 2, 2020)
The chart shows that Bush won 30 states while Gore won 20 states and DC. In the popular vote, Gore received 50,999,897 votes compared to Bush’s 50,456,002, a margin of 543,895. Bush won the election with 271 electoral votes compared to Gore’s 266 electoral votes (one elector in DC did not cast a vote).
| A. State | B. Bush Votes | C. Bush % Votes | D. Gore Votes | E. Gore % Votes | F. Total State Votes | G. Bush Electoral Votes | H. Gore Electoral Votes | |
|---|---|---|---|---|---|---|---|---|
| 1 | WYOMING | 147,947 | 67.76 | 60,481 | 27.7 | 218,351 | 3 | 0 |
| 2 | IDAHO | 336,937 | 67.17 | 138,637 | 27.64 | 501,621 | 4 | 0 |
| 3 | UTAH | 515,096 | 66.83 | 203,053 | 26.34 | 770,754 | 5 | 0 |
| 4 | NEBRASKA | 433,862 | 62.24 | 231,780 | 33.25 | 697,019 | 5 | 0 |
| 5 | NORTH DAKOTA | 174,852 | 60.66 | 95,284 | 33.06 | 288,256 | 3 | 0 |
| 6 | OKLAHOMA | 744,337 | 60.31 | 474,276 | 38.43 | 1,234,229 | 8 | 0 |
| 7 | SOUTH DAKOTA | 190,700 | 60.3 | 118,804 | 37.56 | 316,269 | 3 | 0 |
| 8 | TEXAS | 3,799,639 | 59.3 | 2,433,746 | 37.98 | 6,407,637 | 32 | 0 |
| 9 | ALASKA | 167,398 | 58.62 | 79,004 | 27.67 | 285,560 | 3 | 0 |
| 10 | MONTANA | 240,178 | 58.44 | 137,126 | 33.36 | 410,997 | 3 | 0 |
| 11 | KANSAS | 622,332 | 58.04 | 399,276 | 37.24 | 1,072,218 | 6 | 0 |
| 12 | MISSISSIPPI | 572,844 | 57.62 | 404,614 | 40.7 | 994,184 | 7 | 0 |
| 13 | SOUTH CAROLINA | 785,937 | 56.84 | 565,561 | 40.9 | 1,382,717 | 8 | 0 |
| 14 | INDIANA | 1,245,836 | 56.65 | 901,980 | 41.01 | 2,199,302 | 12 | 0 |
| 15 | KENTUCKY | 872,492 | 56.5 | 638,898 | 41.37 | 1,544,187 | 8 | 0 |
| 16 | ALABAMA | 941,173 | 56.48 | 692,611 | 41.57 | 1,666,272 | 9 | 0 |
| 17 | NORTH CAROLINA | 1,631,163 | 56.03 | 1,257,692 | 43.2 | 2,911,262 | 14 | 0 |
| 18 | GEORGIA | 1,419,720 | 54.67 | 1,116,230 | 42.98 | 2,596,804 | 13 | 0 |
| 19 | LOUISIANA | 927,871 | 52.55 | 792,344 | 44.88 | 1,765,656 | 9 | 0 |
| 20 | VIRGINIA | 1,437,490 | 52.47 | 1,217,290 | 44.44 | 2,739,447 | 13 | 0 |
| 21 | WEST VIRGINIA | 336,475 | 51.92 | 295,497 | 45.59 | 648,124 | 5 | 0 |
| 22 | ARKANSAS | 472,940 | 51.31 | 422,768 | 45.86 | 921,781 | 6 | 0 |
| 23 | TENNESSEE | 1,061,949 | 51.15 | 981,720 | 47.28 | 2,076,181 | 11 | 0 |
| 24 | ARIZONA | 781,652 | 51.02 | 685,341 | 44.73 | 1,532,016 | 8 | 0 |
| 25 | COLORADO | 883,748 | 50.75 | 738,227 | 42.39 | 1,741,368 | 8 | 0 |
| 26 | MISSOURI | 1,189,924 | 50.42 | 1,111,138 | 47.08 | 2,359,892 | 11 | 0 |
| 27 | OHIO | 2,351,209 | 49.97 | 2,186,190 | 46.46 | 4,705,457 | 21 | 0 |
| 28 | NEVADA | 301,575 | 49.52 | 279,978 | 45.98 | 608,970 | 4 | 0 |
| 29a | FLORIDA | 2,912,790 | 48.85 | 2,912,253 | 48.84 | 5,963,110 | 25 | 0 |
| 29b | FLORIDA – Palm Beach County Vote – Certified Results from the Recount | 152,964 | 35.31 | 269,754 | 62.27 | 433,222 | – | – |
| 30 | IOWA | 634,373 | 48.22 | 638,517 | 48.54 | 1,315,563 | 0 | 7 |
| 31 | NEW HAMPSHIRE | 273,559 | 48.07 | 266,348 | 46.8 | 569,081 | 4 | 0 |
| 32 | NEW MEXICO | 286,417 | 47.85 | 286,783 | 47.91 | 598,605 | 0 | 5 |
| 33 | WISCONSIN | 1,237,279 | 47.61 | 1,242,987 | 47.83 | 2,598,607 | 0 | 11 |
| 34 | OREGON | 713,577 | 46.52 | 720,342 | 46.96 | 1,533,968 | 0 | 7 |
| 35 | PENNSYLVANIA | 2,281,127 | 46.43 | 2,485,967 | 50.6 | 4,913,119 | 0 | 23 |
| 36 | MICHIGAN | 1,953,139 | 46.15 | 2,170,418 | 51.28 | 4,232,501 | 0 | 18 |
| 37 | MINNESOTA | 1,109,659 | 45.5 | 1,168,266 | 47.9 | 2,438,685 | 0 | 10 |
| 38 | WASHINGTON | 1,108,864 | 44.58 | 1,247,652 | 50.16 | 2,487,433 | 0 | 11 |
| 39 | MAINE | 286,616 | 43.97 | 319,951 | 49.09 | 651,817 | 0 | 4 |
| 40 | ILLINOIS | 2,019,421 | 42.58 | 2,589,026 | 54.6 | 4,742,123 | 0 | 22 |
| 41 | DELAWARE | 137,288 | 41.9 | 180,068 | 54.96 | 327,622 | 0 | 3 |
| 42 | CALIFORNIA | 4,567,429 | 41.65 | 5,861,203 | 53.45 | 10,965,856 | 0 | 54 |
| 43 | VERMONT | 119,775 | 40.7 | 149,022 | 50.63 | 294,308 | 0 | 3 |
| 44 | NEW JERSEY | 1,284,173 | 40.29 | 1,788,850 | 56.12 | 3,187,226 | 0 | 15 |
| 45 | MARYLAND | 813,797 | 40.18 | 1,145,782 | 56.57 | 2,025,480 | 0 | 10 |
| 46 | CONNECTICUT | 561,094 | 38.44 | 816,015 | 55.91 | 1,459,525 | 0 | 8 |
| 47 | HAWAII | 137,845 | 37.46 | 205,286 | 55.79 | 367,951 | 0 | 4 |
| 48 | NEW YORK | 2,403,374 | 34.53 | 4,107,697 | 59.02 | 6,821,999 | 0 | 33 |
| 49 | MASSACHUSETTS | 878,502 | 32.5 | 1,616,487 | 59.8 | 2,702,984 | 0 | 12 |
| 50 | RHODE ISLAND | 130,555 | 31.91 | 249,508 | 60.99 | 409,112 | 0 | 4 |
| 51 | DC | 18,073 | 8.95 | 171,923 | 85.16 | 201,894 | 0 | 2 |
| TOTAL | 50,456,002 | 47.87 | 50,999,897 | 48.38 | 105,405,100 | 271 | 266 |
APPENDIX E: Explanation of Party Label Abbreviations
Explanation of party abbreviations from the Federal Election Commission’s report titled “Federal Elections 2000: Election Results for the US President, the US Senate, and the US House of Representatives,” published June 2001 and available at fec.gov.
| A. Abbreviation | B. Explanation | |
|---|---|---|
| 1 | AIP | American Independent |
| 2 | AMC | American Constitution Party |
| 3 | BP | By Petition |
| 4 | BR | Buchanan Reform |
| 5 | CF | Citizens First |
| 6 | CNC | Concerned Citizens |
| 7 | CON | Constitution |
| 8 | CPF | Constitution Party Of Florida |
| 9 | CST | Constitutional |
| 10 | D | Democrat |
| 11 | DCG | DC Statehood Green |
| 12 | DFL | Democratic-Farmer-Labor |
| 13 | FRE | Freedom |
| 14 | FSW | Florida Socialist Workers |
| 15 | GI | Green Independent |
| 16 | GPF | Green Party Of Florida |
| 17 | GRA | Green Party Of Arkansas |
| 18 | GRM | Massachusetts Green Party |
| 19 | GRN | Green |
| 20 | GRT-VT | Vermont Grassroots |
| 21 | HGR | Hawaii Green |
| 22 | I | Independent |
| 23 | IAP | Independent American |
| 24 | IDP | Independence |
| 25 | IG | Iowa Green Party |
| A. Abbreviation | B. Explanation | |
|---|---|---|
| 26 | LBF | Libertarian Party Of Florida |
| 27 | LBT | Libertarian |
| 28 | LBT-IA | Libertarian Party Of Iowa |
| 29 | LU | Liberty Union |
| 30 | N | Nonpartisan |
| 31 | NL | Natural Law |
| 32 | NLF | Natural Law Party Of Florida |
| 33 | P | Prohibition Party |
| 34 | PG | Pacific Green |
| 35 | PRO | Progressive |
| 36 | R | Republican |
| 37 | REF | Reform |
| 38 | RFM | Reform Party of Minnesota |
| 39 | SFL | Socialist Party of Florida |
| 40 | RTL | Right to Life |
| 41 | SOC | Socialist Party USA |
| 42 | SWC | Socialist Workers Campaign |
| 43 | SWP | Socialist Workers Party |
| 44 | U | Unenrolled |
| 45 | UC | United Citizens |
| 46 | UN | Unaffiliated |
| 47 | UST | US Taxpayers |
| 48 | W | Write-In |
| 49 | WG | Wisconsin Green |
| 50 | WW | Workers World |
APPENDIX F: Florida’s Palm Beach County Votes
In part because of Palm Beach’s “butterfly ballots,” there was a partial recount[32]We call it a partial recount, as the count was halted by the courts. of votes in certain Florida counties. This chart shows the results of the 433,186 votes from Florida’s Palm Beach County’s Nov. 7, 2000, election and the reported recount of Nov. 14, 2000.
The recount increased the total number of votes by 36 (433,222 less 433,186); Bush’s total increased by 13 votes (152,964 less 152,951); and Gore picked up 22 votes (269,754 less 269,732).
A. Palm Beach County Vote – Results on Nov. 7, 2000[33]Download data page from Florida Department of State website, “November 7, 2000 General Election,” results.elections.myflorida.com, accessed Aug. 14, 2020.
| A. Candidate | B. Party | C. Votes | D. Percent |
|---|---|---|---|
| Bush, George W. | R | 152,951 | 35.31 |
| Gore, Al | D | 269,732 | 62.27 |
| Nader, Ralph | GPF | 5,565 | 1.29 |
| Buchanan, Pat | REF | 3,411 | .79 |
| Browne, Harry | LBF | 743 | .17 |
| Hagelin, John | NLF | 143 | .03 |
| Moorehead, Monica | WW | 104 | .02 |
| Phillips, Howard | CPF | 190 | .04 |
| McReynolds, David | SFL | 302 | .07 |
| Harris, James | FSW | 45 | .01 |
| Chote, May | W | 0 | 0 |
| McCarthy, Ken. C. | W | 0 | 0 |
| Total Palm Beach County Votes: | 433,186 | 100 |
B. Palm Beach County Vote – Certified Results from the Recount[34]Carla Marinucci, John Wildermuth and Carolyn Lochhead, “Bush Claims Victory / BUSH 2,912,790 / GORE 2,912,253 / But Gore campaign pledges to contest result with multiple challenges across … Continue reading
| A. Candidate | B. Party | C. Votes | D. Percent |
|---|---|---|---|
| Bush, George W. | R | 152,964 | 35.31 |
| Gore, Al | D | 269,754 | 62.27 |
| Other | 10,504 | 2.42 | |
| Total Palm Beach County Votes: | 433,222 | 100 |
References
| ↑1 | The following five presidents lost the popular vote as indicated, but still won their elections: 2016, Donald Trump lost by 2,868,686 votes; 2000, Bush lost by 537,179 votes; 1888, Benjamin Harrison lost by 100,456 votes; 1876, Rutherford B. Hayes lost by 264,292; 1824, John Quincy Adams lost by 44,804 votes. |
|---|---|
| ↑2 | For a chart of Percent of Bush Wins Over Gore, see Appendix D: Percent of Bush Wins Over Gore; Electoral College Results. |
| ↑3 | 50,999,897 Gore votes less 50,456,002 Bush votes. |
| ↑4, ↑30 | Federal Election Commission, “2000 Official Presidential General Election Results,” fec.gov, last updated Dec. 2001. |
| ↑5 | “5 Presidents Who Lost the Popular Vote But Won the Election,” history.com, Nov. 2, 2020 |
| ↑6 | Frank Newport and David W. Moore, “Final Poll Shows Presidential Race to Be Dead Heat,” gallup.com, Nov. 1, 2004 |
| ↑7, ↑28 | “(11/09) Patrick J. Buchanan,” The American Presidency Project, presidency.ucsb.edu, Nov. 9, 2000. |
| ↑8 | Accessed Aug. 24, 2020. These numbers do not include the partial count from Florida. It was partial because the US Supreme Court stopped the recount before it was completed. |
| ↑9 | Federal Election Commission, “2000 Presidential General Election Results,” fec.gov, PDF, last updated Dec. 2001. |
| ↑10 | For an Explanation of Party Label Abbreviations, see Appendix E: Explanation of Party Label Abbreviations |
| ↑11 | In the states where he received votes, Nader likely took more votes from Gore than from Bush given that Nader’s politics are more closely aligned with Gore’s than with Bush’s. See Appendix A: Bush, Gore and Nader Comparison of Candidate Positions on Popular Issues at the Time. |
| ↑12 | We used the numbers from the Federal Election Commission PDF, “2000 Presidential General Election Results,” fec.gov. The final certified results in Florida didn’t change any voting totals that would have affected this paper’s analysis or conclusions, see Appendix B: The Palm Beach County Butterfly Ballot. |
| ↑13 | From the source material: “* 138,216 Miscellaneous write- in, blank and void votes were compiled as one total in New York. This figure is not included in ‘Total State Votes.’” |
| ↑14, ↑29 | See Appendix A: Bush, Gore and Nader Comparison of Candidate Positions on Popular Issues at the Time. |
| ↑15 | Based on Appendix A: Gore would have received at least 51% of the Nader votes. |
| ↑16 | 1,948 = [97,488 x 51% = 49, 719] less [97,488 x 49% = 47,769]. |
| ↑17 | See Florida chart in Section IV. #10 |
| ↑18 | Results At Nov. 7, 2000. Results from the download data page from Florida Department of State website, “November 7, 2000 General Election,” results.elections.myflorida.com, accessed Aug. 14, 2020. |
| ↑19 | This number was also unofficially 3,407, which comes from votes “received in the initial, uncertified count of PBC ballots.” Source: “The Butterfly Did It: The Aberrant Vote for Buchanan in Palm Beach County, Florida,” American Political Science Review, Vol. 95, No. 4, December 2001. |
| ↑20 | See a picture of that ballot in Appendix B: The Palm Beach County Butterfly Ballot. |
| ↑21, ↑22 | ACLU, Brief Amicus Curiae of American Civil Liberties Union in Support of Appellants in Fladell v. Palm Beach County Canvassing Board, available at election2000.law.stanford.edu, November 2000. |
| ↑23 | Ronald Brownstein, “Bush Holds Slim Lead; Gore Prepares for Further Court Action,” latimes.com, Nov. 26, 2000. |
| ↑24, ↑26 | See Appendix G: Florida’s Palm Beach County Votes. |
| ↑25, ↑27 | Jake Tapper, “Buchanan camp: Bush claims are ‘nonsense’,” salon.com, Nov. 10, 2000. |
| ↑31 | “Presidential Election of 2000, Electoral and Popular Vote Summary,” infoplease.com (accessed Nov. 2, 2020) |
| ↑32 | We call it a partial recount, as the count was halted by the courts. |
| ↑33 | Download data page from Florida Department of State website, “November 7, 2000 General Election,” results.elections.myflorida.com, accessed Aug. 14, 2020. |
| ↑34 | Carla Marinucci, John Wildermuth and Carolyn Lochhead, “Bush Claims Victory / BUSH 2,912,790 / GORE 2,912,253 / But Gore campaign pledges to contest result with multiple challenges across Florida,” SFgate.com, Nov. 27, 2000; and Brian C. Kalt, “Winning Recounts: Essential Mathematical and Statistical Insights for Election Lawyers,” digitalcommons.law.msu.edu, 2014. |